VMware Cloud Foundation (VCF) and vSphere Foundation (VVF) Licensing Dashboard
Since the acquisition of VMware by Broadcom, quite a lot has changed when it comes down to licensing your VMware products. Products were discontinued (I’m looking at you SaaS offerings!), perpetual move to subscription based and per CPU changed to Core Based licenses. Not all are due to the overtake, the move to subscription-based licensing for example has been going on for a longer time already.
VMware by Broadcom has published two articles regarding the calculation:
This article describes how to count cores and TiB capacity for VCF and VVF and describe the limitations, minimal core counts etc.
This article contains a Powershell script allowing you to connect to one or more vCenter Appliances and collect the required information for your amount and capacity of licenses. It is created by William Lam and works like a charm!
A customer I am working for now has quite a dynamic environment and asked me if it was possible to create a more dynamic overview which shows real-time information. Since I always enjoy spending some time in Aria Operations I went to work… This part describes the Core counting bit of the process. In the second part I will add the vSAN TiB Capacity calculation to the existing views and dashboards.
Part 1: Counting the Cores
Creating the Metrics
The new licensing model required a minimum of 16 cores per CPU licensed. This means that we will have to calculate the number of cores per socket and perform some magic to determine if it is <= 16, or higher than 16. In case it’s lower or equal, the value should be set to 16 and in case it’s higher, the value should remain unchanged.
In Aria Operations, the object type “Host System” contains the following two properties we will use first:
- Hardware|CPU Information|Number of CPU Cores – This displays the total amount of cores in the system (it already excludes Hyperthreading so no need to worry about that)
- CPU|Number of CPU Sockets – This displays the amount of CPUs present in the system
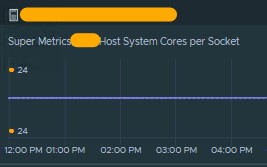
Unfortunately, there is no out of the box property for cores per socket, thus we will have to create this through a simple super metric. You will have to create a new supermetric for object type “Host System” and the formula should look something like this:
sum({This Resource: hardware|cpuInfo|numCpuCores})/{This Resource: cpu|numCpuSockets}You will want to enable this supermetric (as well as the next metrics that we will create) on all policies containing ESXi hosts that you want to include for your license count. So one additional dependency you have is that your “licensed systems” should already be in Aria Operations. Once enable it can take 1 or 2 collection cycles for the metric to become visible on your object:
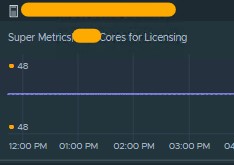
As a next step, we will need to determine if the amount of cores per socket is either 16 or lower, or higher than 16 and adjust the count for licensing to 16 when required. We will be creating a new supermetric (SM) for this
Just like the first SM, it will be created on object type “Host System”. It used the previously created supermetric to provide input. The formula is as follows:
sum(({This Resource: Super Metrics| Host System Cores per Socket}<=16?16:{This Resource: Super Metrics|Host System Cores per Socket})*{This Resource: cpu|numCpuSockets})The SM uses a Ternary Operator (if/then/else) – documentation can be found here. Again, don’t forget to enable the metric collection in your policies and after a few cycles it should become visible:
When it comes down to core counting, we now have all the data we need. One thing left to do is that we still need to put it in a nice view and a respective dashboard. Remember that we will be adding the vSAN info in the second part!
Creating the View(s)
In the dashboard that we will create, I wanted to add three view widgets:
- Dashboard Description: Short descriptive text widget explaining the dashboard. I will not describe the creation of this view as it is simple to do.
- Environment Selector: Multi Level list of objects to select from. The goal here is to allow selection of either the entire vSphere Environment, or a subset in the form of a vCenter Server with clusters, or even a single cluster. For simplicity, I will add a list widget here manually selecting the object types to be displayed. This will be described in the “Creating the Dashboard” section.
- CPU Core Overview – Host Licensing: Overview including the core counts required for licensing.
CPU Core Overview – Host Licensing
This is a custom view of the type “List”. You can easily create a new view by going to Visualize à Views à Manage and click Add. The subject that we want to add is “Host Sytem”. For increased visibility set the Group by subject to “Cluster Compute Resource”. Next for the “Host System”, add the following metrics and properties:
- CPU|Number of CPU Sockets – This will display the number of in-use sockets per host.
- Hardware|CPU Information|Number of CPU Cores -This will display the total number of CPU cores in the host without HT.
- Super Metrics|Host System Cores per Socket – This will display the amount of cores per socket
- Super Metrics|Cores for Licensing – This will display the amount of licenses that the host will consume
Feel free to give the metrics a more meaningful name in the Metric Label field and add some metric coloring by setting the Red Bound value to “Below” and “16” for the “Amount of Cores per Socket metric”. This will ensure that all hosts with less than 16 cores per socket will have this value colored red, indicating that additional licenses are required. You can check if the view looks ok by selecting a valid preview source:
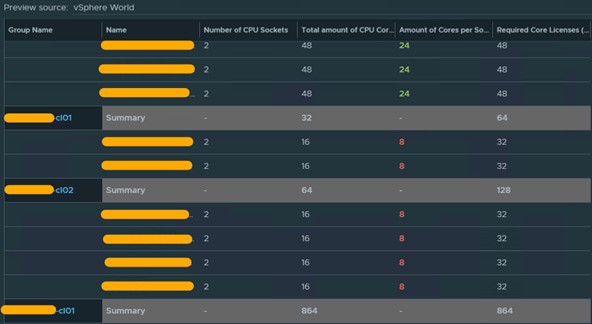
The Name and Cluster names are automatically added to the lists.
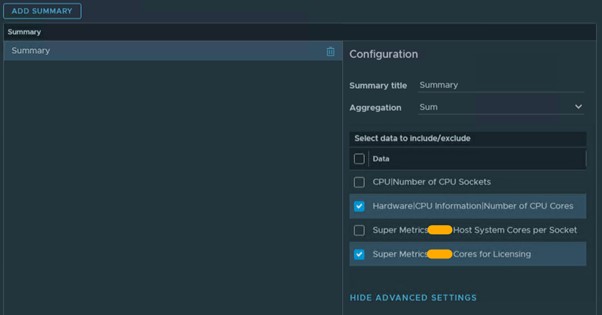
Lastly, in the Summary tab, you will want to add summary rows for the Number of CPU Cores and the Cores for Licensing. It makes no sense to add summary rows for the other metrics.
Save the view and close the editor. Next step is to create the dashboard. Alternatively, you could stop here and just create (scheduled) reports utilizing this view.
Creating the Dashboard
Next and final step for this part is to create the dashboard in Aria Operations.
Proceed and create a new dashboards with a proper name and start by adding the text based widget on top. It’s not mandatory, but I prefer providing some additional information to provide guidance to the audience who will be using the dashboards.
Since we at ITQ love things in Orange, we’ll be adding the text here in shiny orange as well:
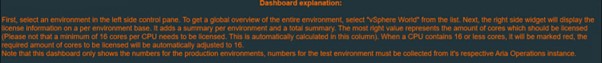
Secondly, we will add the widget allowing you to select an environment (vCenter or Cluster) or to select vSphere World to provide the complete overview.
I have used a standard object list from the widget selection screen for simplicity as mentioned earlier. It is set to be a Self Provider and thus does not depend on other widgets. The input data can be left default (All Objects included) because we will configure an output filter here to dynamically show all the corresponding items in the environment. While at the “Output Filter” screen, expand “Basic” and then “Object Types”. Now select the following object types (yes, you can select multiple)
- Cluster Compute Resource
- vCenter Server
- vSphere World
Feel free to add additional types if you like (datacenters for example or other custom groupings that you might have created). Optionally you can create a filter to filter out certain objects.
Next we will add the License Overview – Cores view. We need to move the selector on the bottom right from “widgets” to “views” and next we can drag a view widget on to the canvas. While configuring the widget, we need to make sure that the “Self Provider” option is switched off for this widget. The input data can be left at it’s default setting of “All Objects” and at the output data section, we select our previously created view.
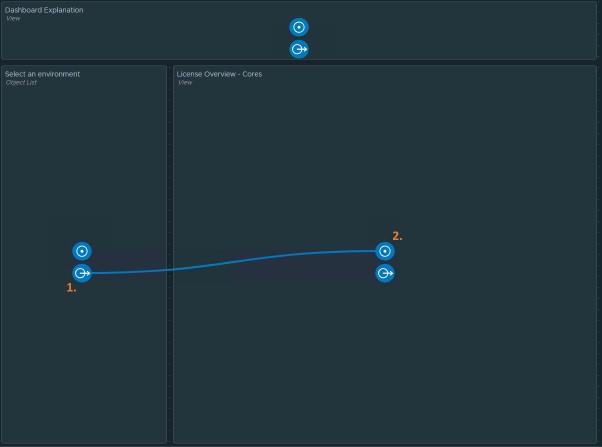
The last thing that we need to do, is to create the relationship between the environment selected and the license overview. To get to the Interactions screen, you have to select the “Show Interactions” button at the top of your design canvas.
The next view will allow you to create an outgoing object interaction from your environment selector to your license overview. Configure it by dragging a line from 1. to 2. And click “Hide Interactions” to go back to your dashboard design.
Save your dashboard and you are all set!
In the next part we will be re-using the dashboard and views we have created and updating them to include the storage capacity bit as well. Stay tuned!