Aria Operations – What is left for provisioning? – Visualized
Introduction
As promised in my last post about resources left for provisioning, here’s one about how to visualize the amount of resources left in your clusters for provisioning.
At my customer we have several different policies active on several different clusters with overcommit ratios configured on vCPU and Memory.
The previous post explained how to create those metrics and how to make them available for your automation toolkit. This post is to give you something nice to look at as well. Besides looking nice, you can of course make things a bit more useful and do some reporting and alerting for example. The reporting and alerting will be covered in part three which I will hopefully complete next month.
Pick up where we left
In part one of the series, we have configured the policies to enable the allocation metrics on a cluster level. Now, we want to visualize this information and decide on how we want to show it: We can either display the clusters all in one large widget and present the overcommit ratios along with the information, or we can divide them into sections (per overcommit policy type for example) each on it’s own scoreboard widget. For this post, I will focus on the last option, but I will also provide the info you can you to create your dashboard the first way. I will create a total of three scoreboard widgets, those are for CPU, Memory and (vSAN) Storage.
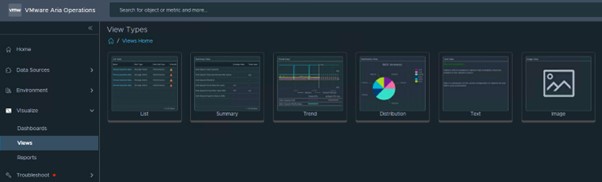
The Views
To provide additional information regarding the dashboard, I prefer to place a text widget on top with this info.
Text Widget
To create a new text widget, go to Visualize -> Views and select Create. Now select Text as the view type to create a text widget
At step 1, give the widget a useful name and description. Do not forget to select the Dashboards through the View widget at the settings part. If not selected, you will not be able to find your widget to place on the dashboard.
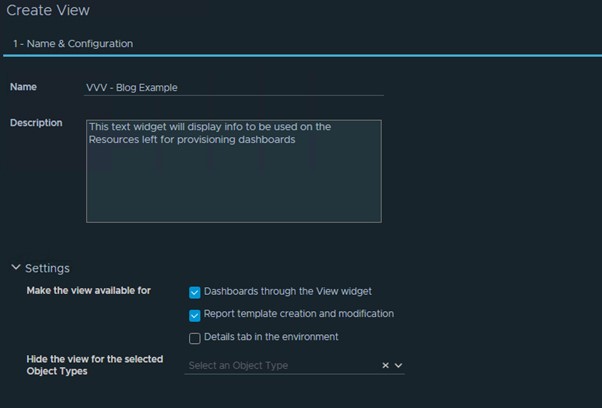
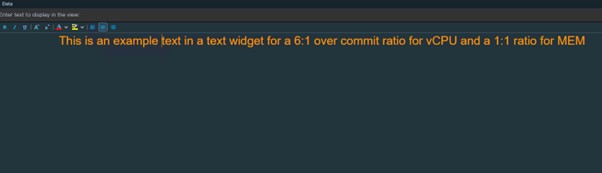
At step 2 you will need to add a subject, in my opinion the object type “cluster compute resource” makes most sense as that is where we will create the dashboard for. There is no need to select metrics or properties on the left side control pane. The “Data” pane is where you can type and format the text you want to display. I always prefer to use dark mode and then “ITQ Orange” always works really well as text color 😊
No need to change anything on step 3 – Time Settings or step 4 – Filter
Now click Create to save the text view
Scoreboard Widgets
I prefer to have the cluster information shown in a scoreboard view. I prefer the options to layout and coloring on those and the allow for customization as well.
First, we need to determine wat info we want to have on the CPU scoreboard, for me this will be the following:
- Cluster name
- Total amount of vCPUs for provisioning
- Amount of allocation vCPUs (on powered on VMs)
- vCPUs left for provisioning
- This will be a supermetric we will need to create
- % of vCPUs used
- This will be a supermetric we will need to create
- This is actually the metric we can use for alerting later on
For the Memory scoreboard we want the following info:
- Cluster name
- Total amount of useable memory (in GB)
- Amount of memory allocated (in GB)
- Memory left for provisioning (GB)
- This will be a supermetric we will need to create
- % of available memory provisioned
- This will be a supermetric we will need to create
- This is actually the metric we can use for alerting later on
For the vSAN Storage we will add:
- Cluster name
- Since we need to use “vSAN cluster” objects to present the vSAN info, we will need to be creative here to display the cluster names as that is a property of the object type “cluster compute resource”
- Total usable space (TB)
- Physically used space (TB)
- Diskspace remaining on vSAN cluster (TB)
- RAID1 (FTT 2) diskspace left
- This will need to be a supermetric we will need to create
- RAID6 diskspace left
- This will need to be a supermetric we will need to create
There, that’s a lot of info to prepare, so lets start. I will describe the creation of the vCPU Scoreboard and supermetrics in detail and provide the XML and Supermetric info for Memory and Storage to use.
To add the two supermetrics required for the vCPU info, go to Configure, then Supermetrics and add a new supermetric for the “vCPUs left for provisioning” metric first.At step 1. Give the Supermetric a useful name and description (I tend to forget the description and this makes it hard sometimes to determine where it is actually used!)
At step 2 – Object Types, select “cluster compute resource” to apply the SM to these type of metrics
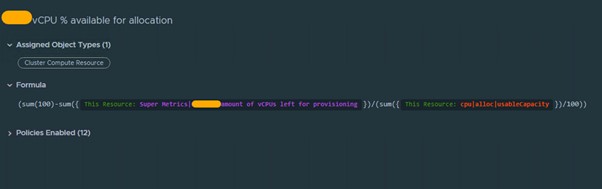
At step 3, create the SM as follows:
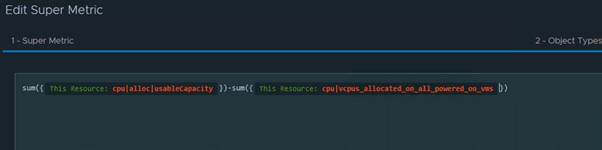
Please note that the “This Resource:” actually refers to the “cluster compute resource” object
Set the Unit to “vCPUs” and click next.
As a final step, you can enable the collection of the metric for specific policies:
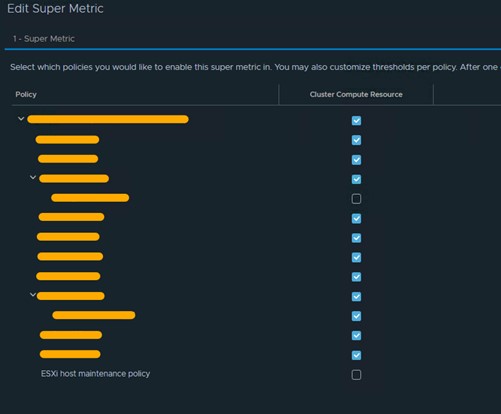
Do not forget to do this, otherwise your metric won’t be available for the clusters you want to want to have this info for 😊
Now save the first Supermetric. Note that it will likely take one or two data collection cycles (performed every 5 minutes by default) before the metric is available on your cluster compute resource objects. When they are available, proceed and follow the same steps to create the Supermetric for the % of vCPUs used. As you can see below, the Supermetric created in the prior steps will be reused now to perform the calculation. The “This resource” metric again refers to the “cluster compute resource” object.
Enable the metric in your policies and save it.
Next we can finally create the Scoreboard Configuration. In order to do this, go to Configure -> Configuration Files and click Widget Metric Configuration. Proceed and create a new configuration file (optionally you can organize those in folders if you like)
You will be presented with the following view:
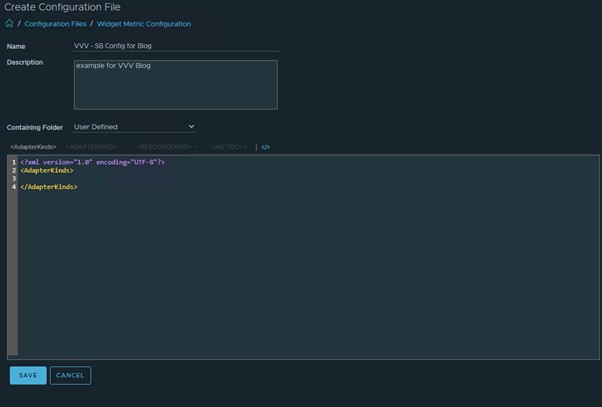
After giving the config file a name and description we can add the details. The first times might give you some struggles, but believe me that eventually it becomes better 😊 If you click on line 3, you will see that the option adapterkind becomes available, you can select “vCenter” here and click Go.
Two new lines indicating the start and end of this adapterkind are added now and next, you can add a resourcekind, here click “cluster compute resource”. Again, two new lines are added. Finally, you can add the specific metrics and/or properties that you want to see in your scoreboard. You can add multiple metrics and properties under the same resourcekind.
Add the five items you want to show to the list:
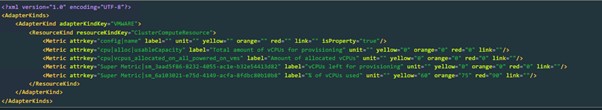
Besides just adding them, you can also do some customization here. I have created customized labels to make things easy to read on the dashboard and also on the % used, I created indicators for colorization of the metrics if the % goes above a certain level. When you are done, save the config file and proceed creating the files for respectively Memory and Storage. I have created those as follows:
MEM: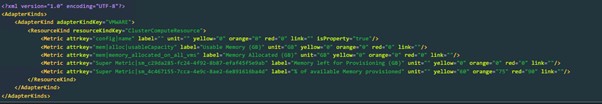
Supermetric 1:
(sum(100)-sum({This Resource: Super Metrics|Amount of RAM left for provisioning
})/(sum(({This Resource: mem|alloc|usableCapacity})/1024/1024)/100))
Supermetric 2:
(sum({This Resource: mem|alloc|usableCapacity})/1024/1024)-(sum({This Resource:
mem|memory_allocated_on_all_powered_on_vms})/1024/1024)
vSAN Storage:
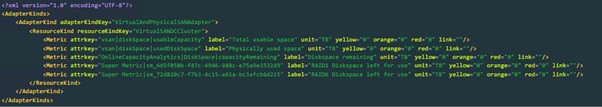
Supermetric 1:
sum({This Resource: OnlineCapacityAnalytics|DiskSpace|capacityRemaining})/3
Supermetric 2:
sum({This Resource: OnlineCapacityAnalytics|DiskSpace|capacityRemaining})/1.5The Dashboard
Once you are done creating all this, it’s (finally) time to create the dashboard! Create a new dashboard and give it a proper name and start by switching the bottom pane to Views. Now you can drag a Text View widget on you canvas. Size it accordingly and click the pencil icon on the top right side to edit it.
On the configuration tab of the widget, I replace the name of the widget with a “-” as it will only display text which is descriptive enough in my opinion. Ensure the Self Provider option is set to On.
On the Input Data tab, select a cluster compute resource for which you are going to use the widget (this is to ensure it get’s displayed). Finally, on the Output Data tab, search and select the text widget that we have created earlier. Click Save to finish.
Next, switch back to Widgets and drag a Scoreboard widget to you canvas. Resize and place to your preferences and edit it again once done. I prefer to give this one a descriptive name but of course you can name it any way you like. On the Configuration ensures that the following configuration is in place:
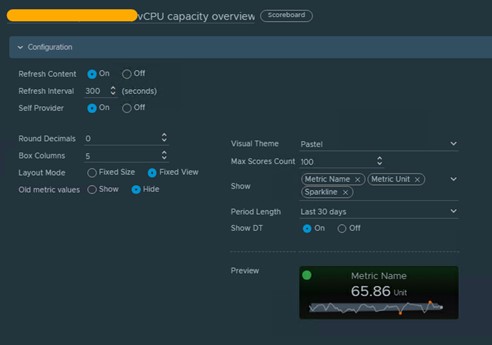
Feel free to play around with that visual settings to present the widget in the way you like it most and proceed to the Input Data tab. Here you can manually add the cluster objects that you want to show in this widget. On the Input Transformation tab, ensure that the “Self” option is selected.
Now on the Output Data tab, select the Configuration file that you have created to show your vCPU capacity metrics. An Output Filter is not required at the last tab, so click save to continue.
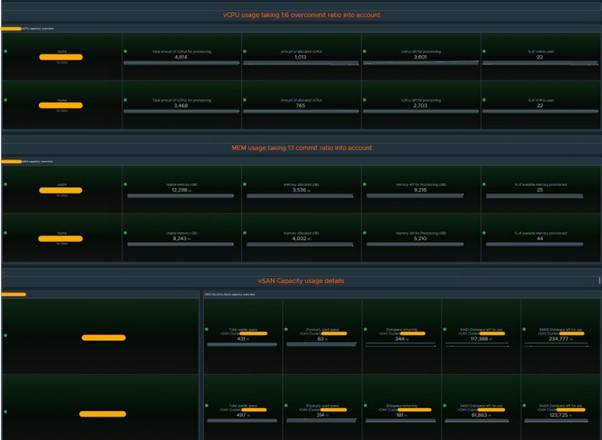
You vCPU dashboard should be shown now on your canvas. Repeat the steps above to also add the widgets for Memory and Storage and save the dashboard once you are happy with it 😊
At the end, your dashboard should look something like this:
Hopefully this article is useful to someone! Feel free to reach out in case you have any questions!
Next part will describe some content regarding the creation of reports and alerts based on this information, stay tuned!