vROPS & vSAN – Per SP capacity usage reporting dashboard – Part 2
Part 1 of this blog post described the use case identification and preparation steps required in vCenter in order to proceed and create some content in vRealize Operations. This post will describe the steps required in vROPS:
- Create Group Type
- Create Custom Group and set dynamic membership
- Create Supermetrics per vSAN policy and include them in active policy
- Create Dashboard including new metrics per vSAN policy
Create Group Type
As we will be creating multiple custom groups, 1 per storage policy, I decided to create a new Group Type to hold these groups. In order to create a new Group Type, log into vROPS and go to Administration > Configuration > Group Types. Then click the green + sign to create a new group type:

The only thing I worried about here is to create a group type which describes the type of object in it. Once created, the group type should be visible if you go to Environment > Groups and Applications > Custom Groups.
Optionally you could assign a different icon to the container (via Administration > Configuration > Icons).
Create Custom Group and Set Dynamic Membership
Now that we have our container ready, we can start creating custom groups. As mentioned earlier we will create a separate group per storage policy. Members are included dynamically by vSphere Tag which should be assigned on each VM with a storage policy assigned to it.
In vROPS, go to Environment > Groups and Applications > Custom Groups and click the green + sign, ensure to set up the group correctly:
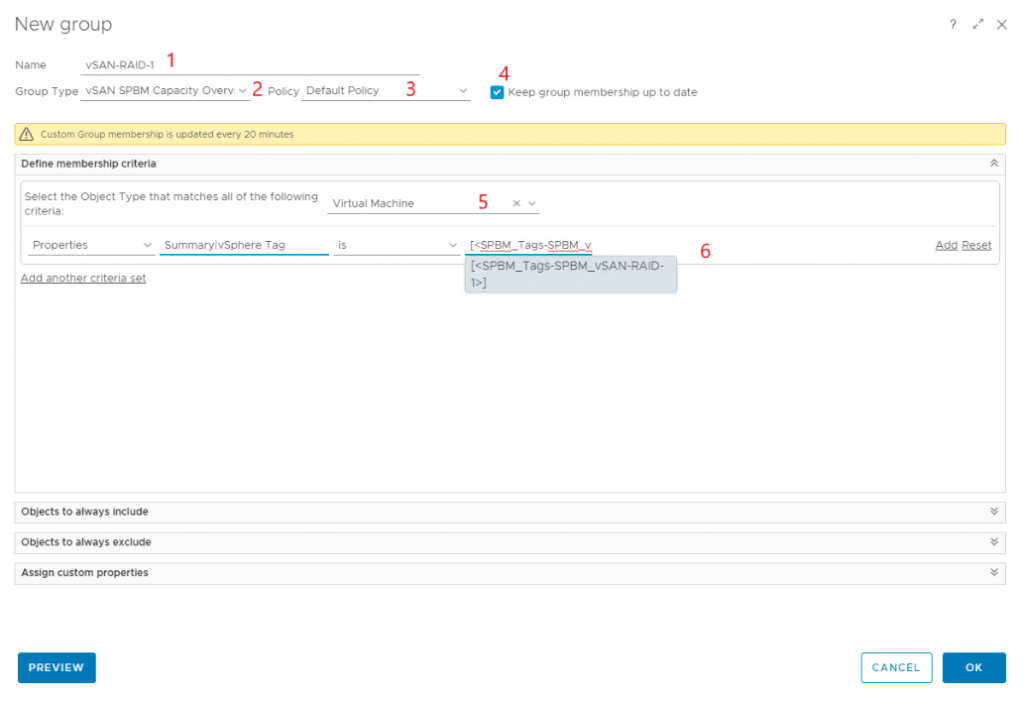
- Give the group a clear name (I used the same name as my storage policy).
- Select the newly create container from “Group Type”.
- Make sure to include it in an active policy, I only have a default policy running.
- Ensure to select “Keep membership up to date” – otherwise new and changed VM’s won’t be included.
- At the object type selection, select “vCenter Adapter > Virtual Machine”
- At the first column, select “Properties”. On the second, select “Summary > vSphere Tag”. On the third, select “is”. In the last column, you can either select the tag from the pulldown list if you don’t have many tags, but it might be a better idea to just paste in the correct tag name. The system will also list any combination of tags assigned to a VM and so it might mess up the correctness of the dashboards later on.
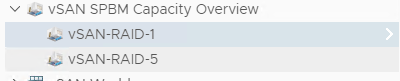
If the groups are created correctly, they should be displayed now and if tags are assigned correctly, you should be seeing some VM’s being members of the groups as well.
We’ll leave the groups for now and create some super metrics.
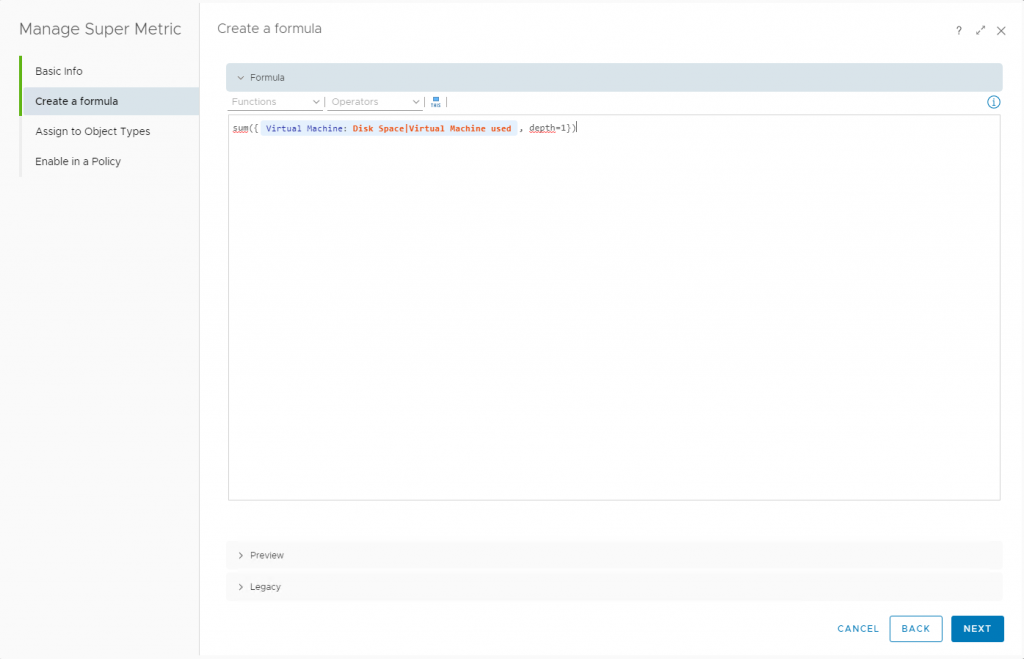
Create Super metrics per vSAN policy and include them in active policy
Why would we need super metrics? Besides the fact that it just sounds badass they can be quite useful as well. In this case we are going to create some very simple super metrics that calculates the sum of the “in-use” space of the virtual machines in a custom group.
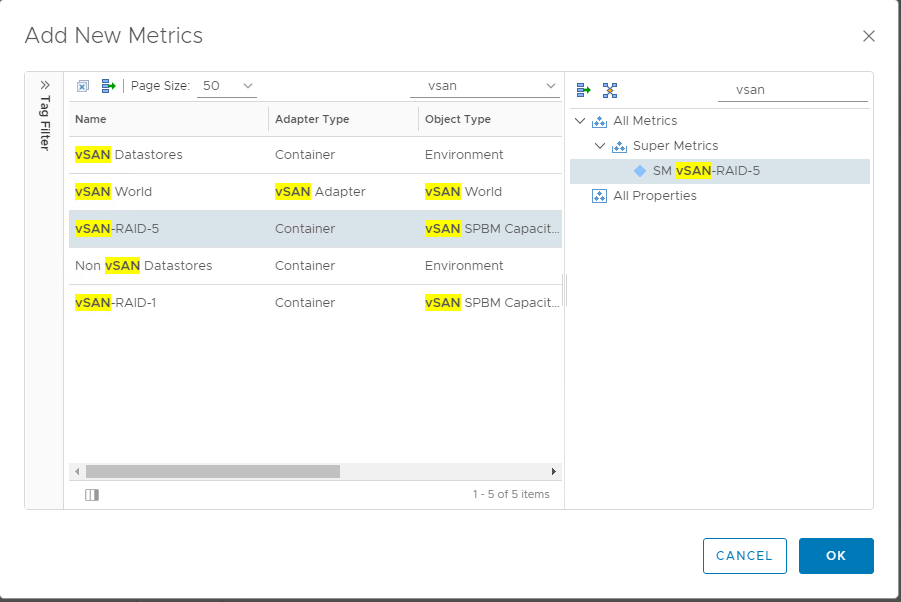
The image below shows the metric config for the Raid 1 policy.
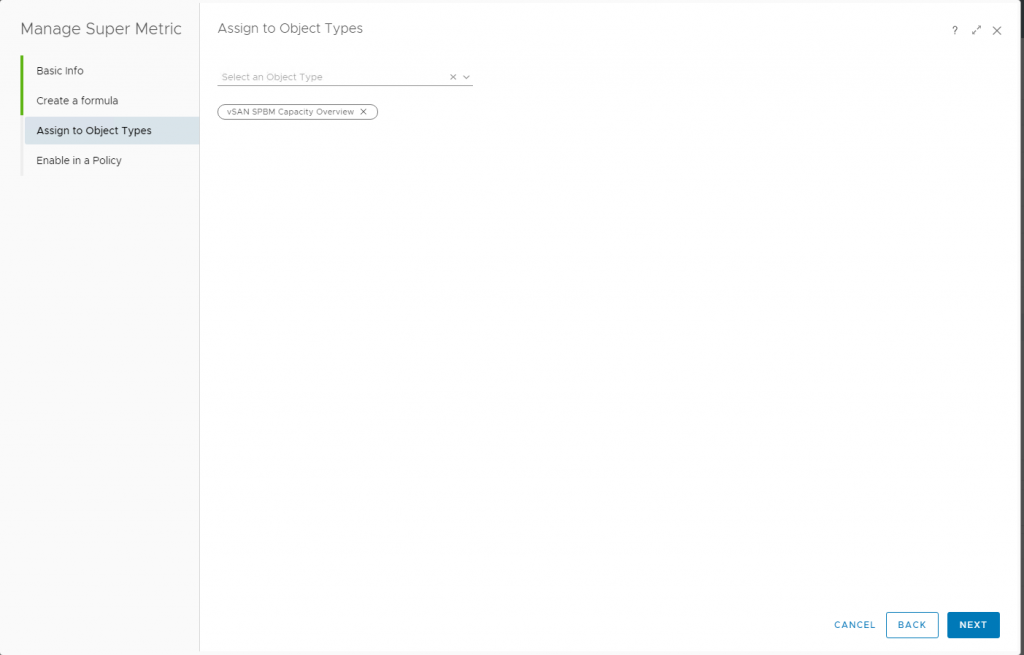
At the “Assign to Object Types” screen, assign the super metric to the customer grouping object created earlier:
If you are using vROPS 8.x, you can directly include the metric in your active policy. If using a version before 8, ensure to edit your policy to include the created super metrics.
Create Dashboard including new metrics per vSAN policy
The final step is to put it all together and show it off in a fancy display. In vROPS, create a new dashboard and give it a proper name.
Add a metric chart to the canvas for each storage policy you want to list (again, give it a proper name 😊) and configure them one by one, ensure the following properties are configured:
- Refresh Content On
- Self Provider On
- Input Data Metrics (vROPS 8.x)
- Included Object Your vSAN custom group
- Metric Created super metric for selected policy
I prefer the metric chart, so you also have a historical view of the policy usage. The image below shows my (tiny) environment where I simulated some policy changes to show this:
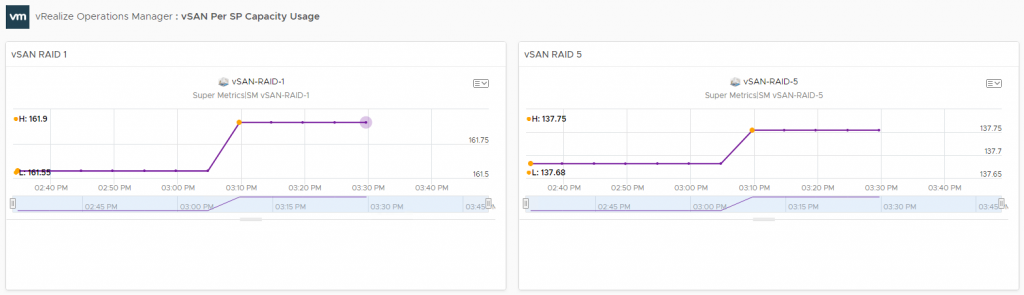
There you go, one dashboard showing the VM space consumption on vSAN per Storage Policy.
Please be aware that this method is not the holy grail of reporting “in use” storage space but at least it is better than nothing 😊 Remember to keep the tagging up to date by running the PowerCLI script from time to time.
Very nice. With this, is there a way to have a dashboard that shows actual space usage per VM across a vSAN stretched cluster?
We wish to confirm space usage as we migrate new workloads to our new vSAN implentation and just wish to see the usage. It seems vRops 8.5 included vSAN dashboards do not break down to a per Vm actual usage across all nodes.
Hi Matthew,
The problem is that there is no auto created relationship between a VM and the vSAN disks/diskgroups where it’s components reside. Thus creating a dashboard where you can view the consumption and distribution per VM is not possible unfortunately. Out of the box vROPS 8 has some good vSAN stretched cluster graphs though in case you want to keep an eye on storage consumption per site.
Hope this helps